Understanding Your ECG

This summary gives a very simple overview of how to analyse your own ECGs. If you have ever wondered what the red lines on your ECG mean then read on. Note- this is not a substitute for medical interpretation, especially if you experience new or worsening symptoms. However, the automated labels can sometimes be 'inconclusive' or wrong, so it is always good to have a basic understanding.
The Fundamentals
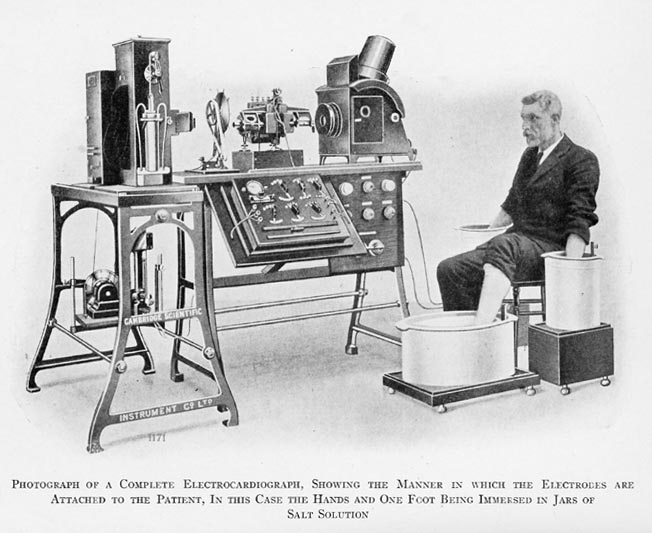
An electrocardiogram (ECG) is a recording of your heart’s electrical activity over time. The heart is the predominant site of electrical activity in the chest and as ECG leads measure the difference in voltage between two connected points, they are essentially measuring the voltage across the heart. On a hospital ECG machine, this is done by placing leads and stickers stickers across the body and on a smartwatch this is done by placing your two hands on different parts of the watch.
A standard hospital ECG typically captures 10 seconds of heart rhythm data data. Consumer devices, such as the Apple Watch, usually record over 30 seconds.
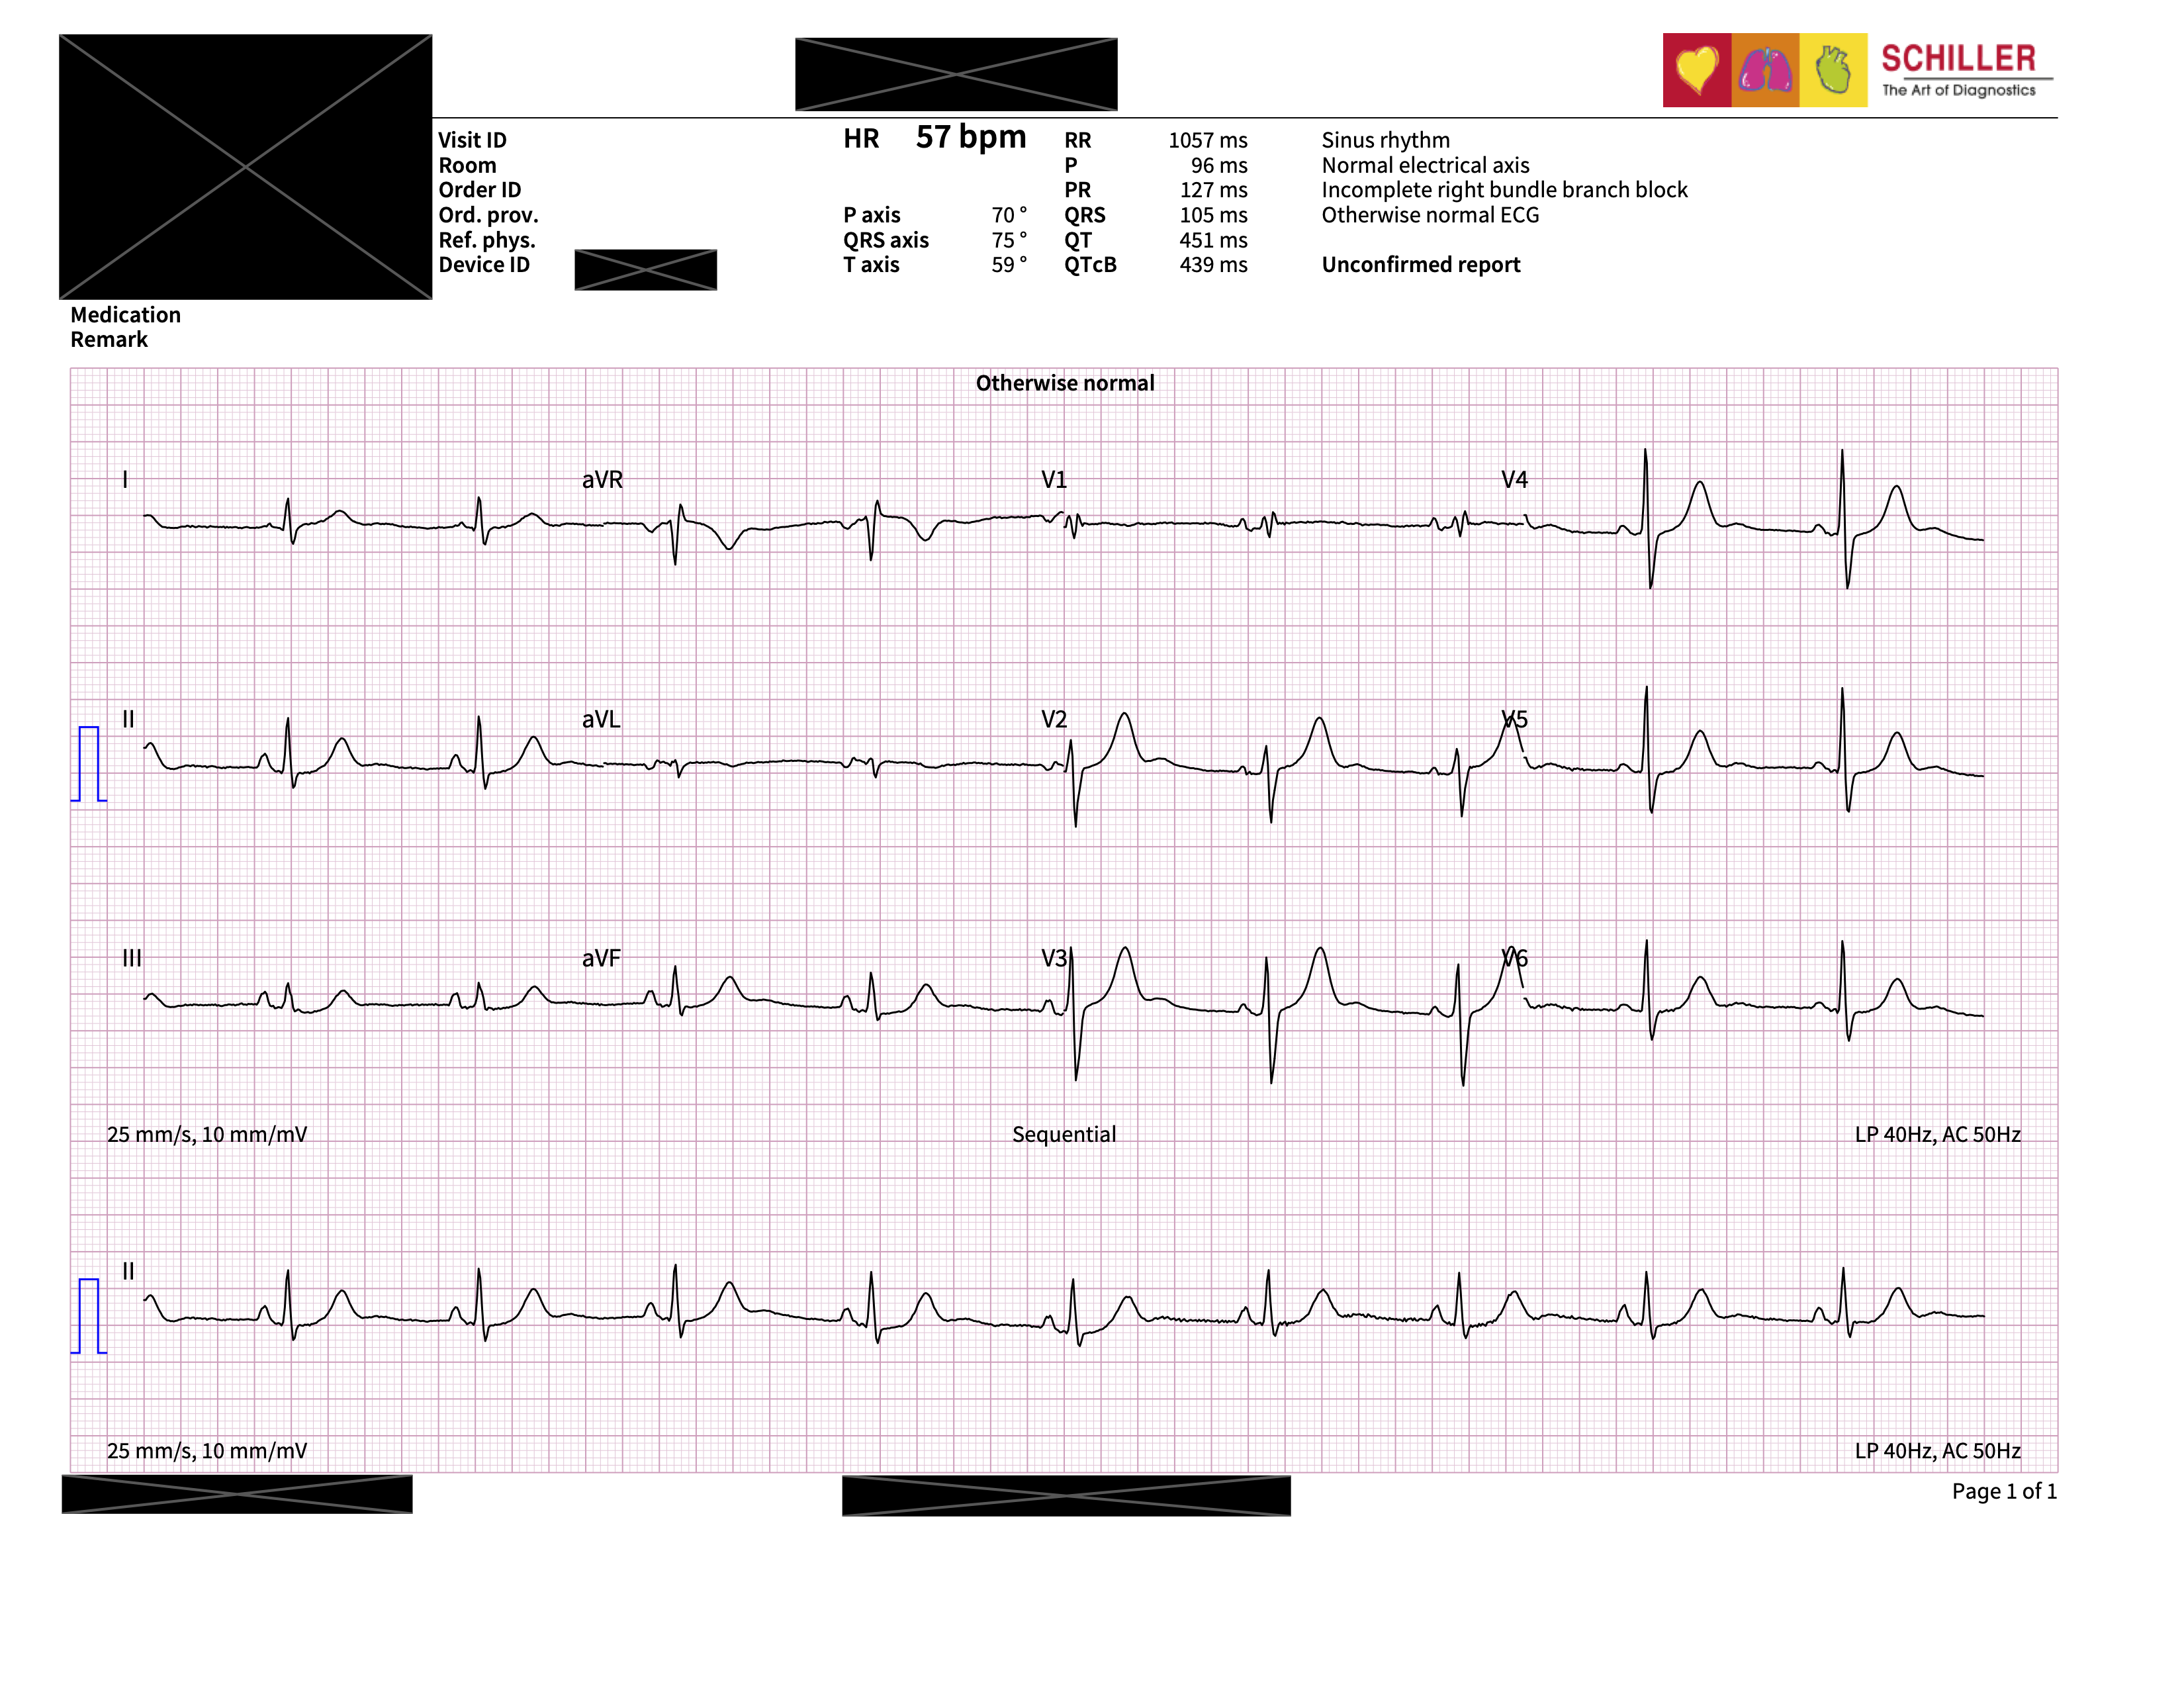
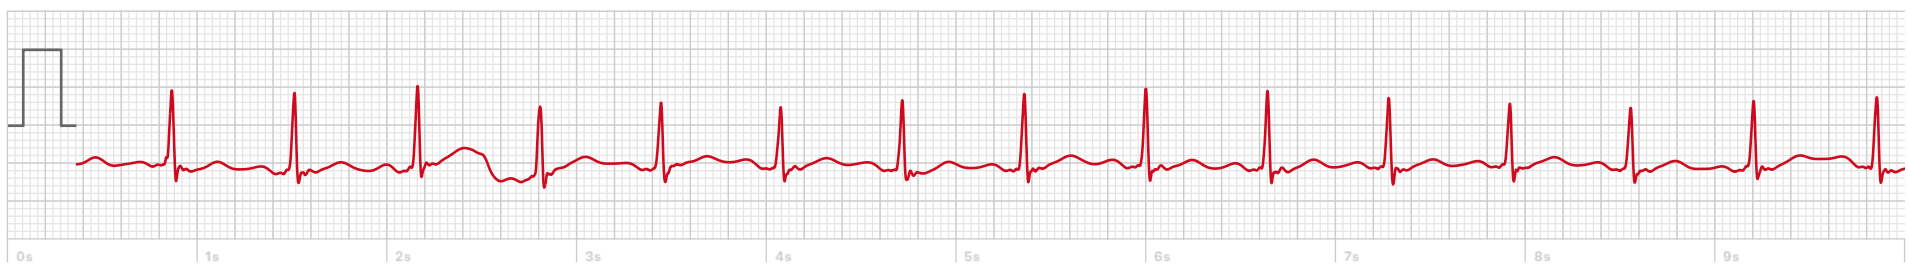
The electrical activity is then plotted as a wave tracing across time:
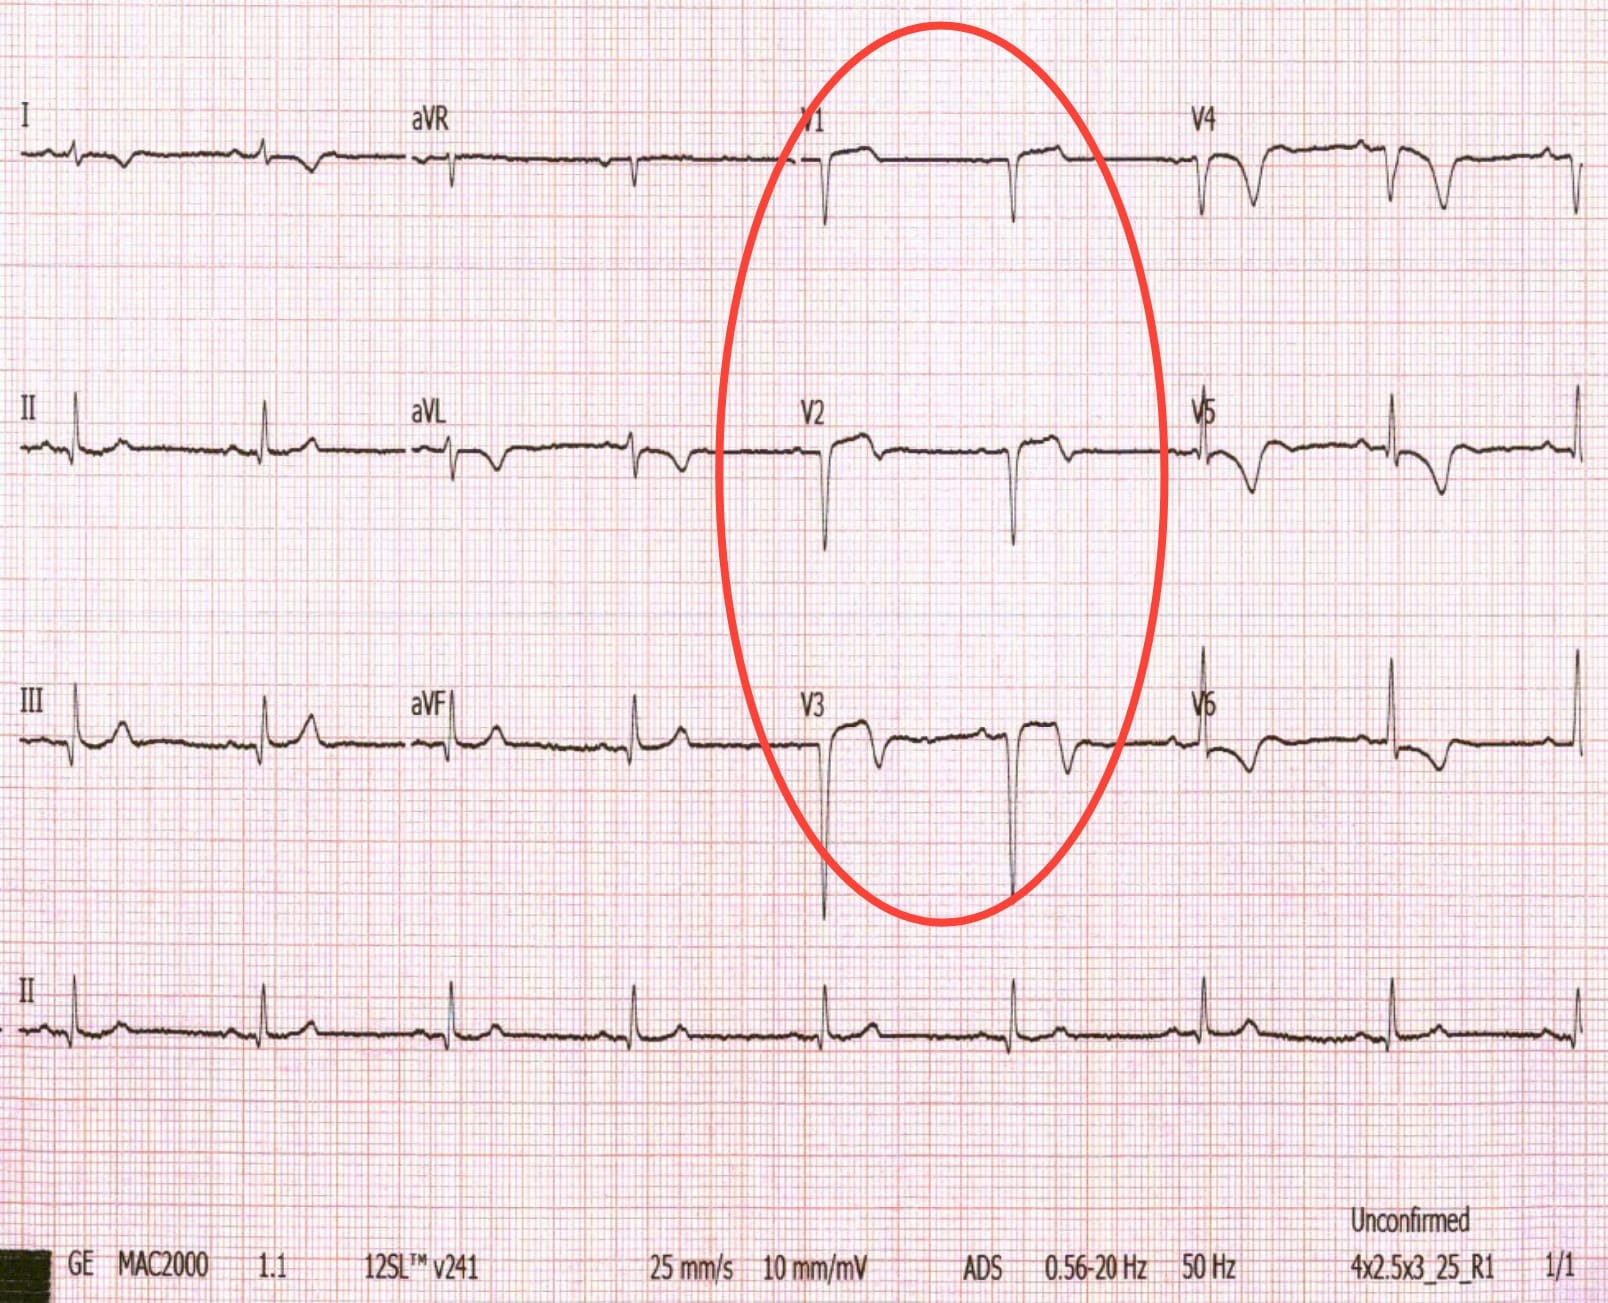
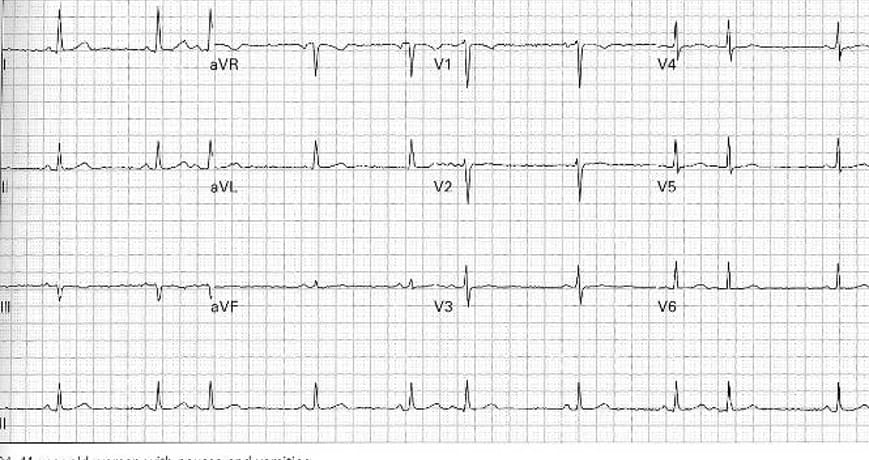
Hospital ECGs often include multiple rows of complexes. These correspond to different pairs of “leads” - each demonstrating the electrical activity from different perspectives to show regional differences. This allows for assessment of how electrical signals move through the heart and helps localise issues, such as heart attacks that can effect different sections of the heart.
The 'Normal' Sinus Rhythm ECG
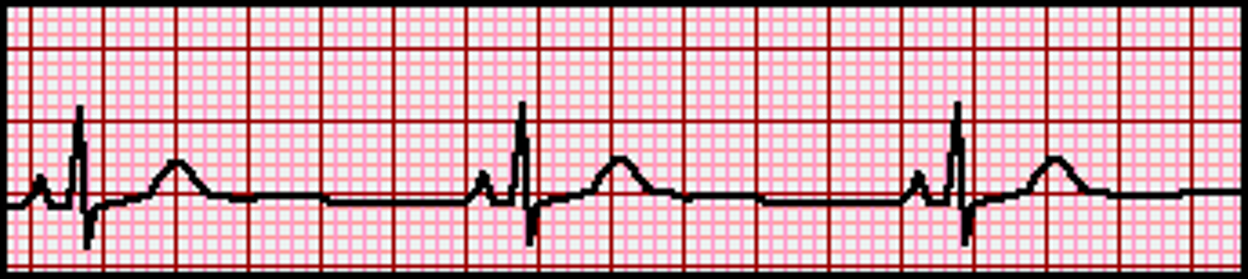
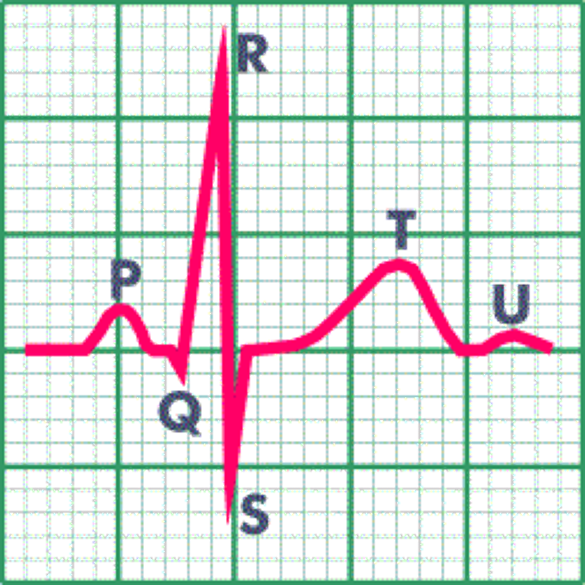
During sinus rhythm each heartbeat generates a repetitive pattern of electrical signals:
- QRS complex – the tall, sharp spike that represents contraction of the main pumping chambers (the ventricles)
- P wave – the small hump before the main spike that signals contraction of the upper chambers (the atria)
- T wave – hump after the spike that shows recovery of the ventricles
In normal sinus rhythm, these occur in a regular sequence and at generally consistent intervals.
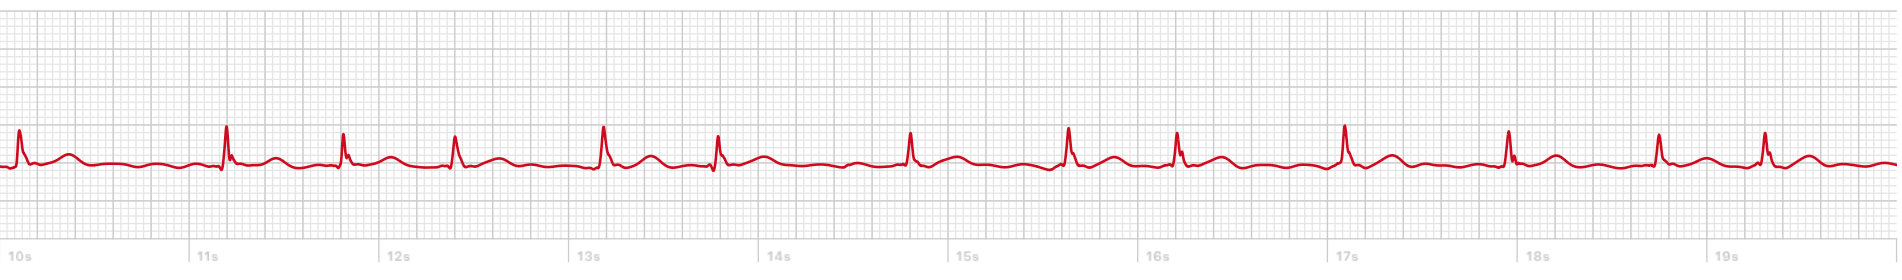
What Happens in Atrial Fibrillation?
In atrial fibrillation (AF), the normal sequence is disrupted:
- P waves are absent due to disorganised electrical activity in the atria
- The QRS complexes occur at irregular intervals
- The heart rate may be elevated and variable
These changes are hallmarks of AFib and can often be seen on a short ECG strip.
The AF Exceptions
However, it is not as simple as this distinction as not all irregular ECGs are AF. It’s important to differentiate AF from other conditions or artefacts and I have included some of the common misinterpreted cases below:
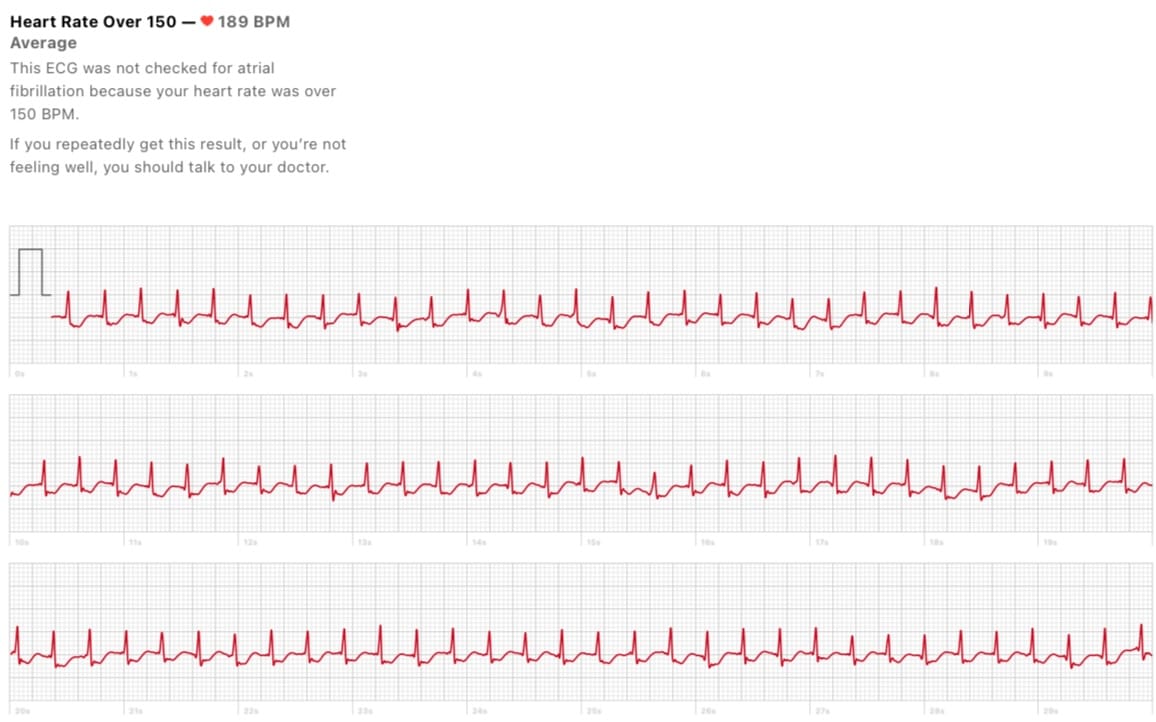
Supraventricular tachycardia (SVT) – this is a different arrhythmia, a regular, fast rhythm that also arises from the upper chambers. It can be challenging to differentiate from AFib, especially because it can present with overlapping symptoms such as palpitations. A key difference on ECG is the organisation and regularity of an SVT. However, it is important to differentiate this from AF because it is not associated with the same stroke risk and treatment plans can differ.
Premature Atrial Complexes (PACs) - Also, known as ectopics, these can appear like an irregular rhythm on an ECG and can be confused with Atrial Fibrillation. They can also present with palpitation symptoms and can co-exist in people with AF.
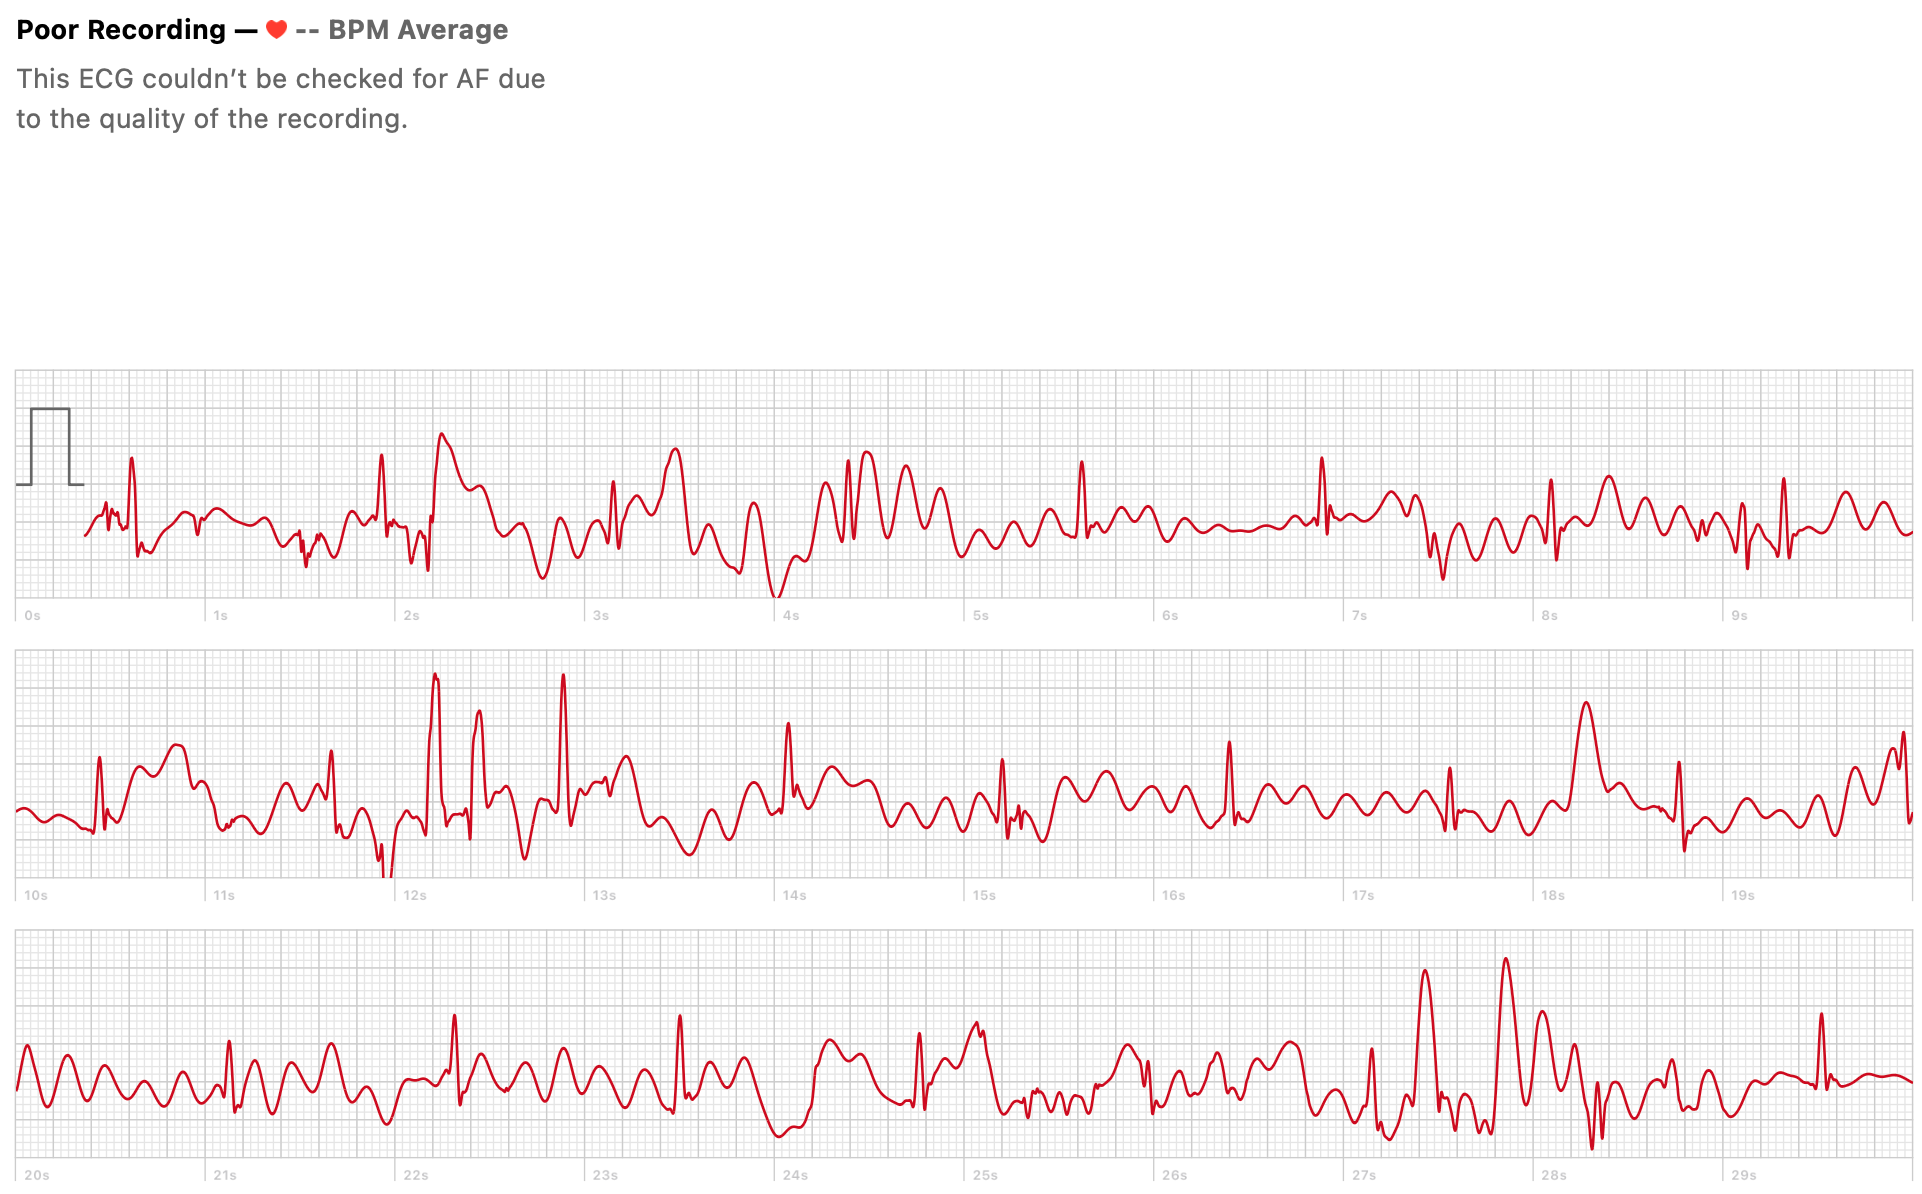
Artefact – This is a very common reason for ECG misinterpretation. If you have tried to record an ECG on a smartwatch, you will know that movement, tremor or instability will result in a really messy tracing- this 'noise' is known as artefact because it does not reflect underlying electrical activity. It can mimic irregular rhythms and the simplest solution is to try and acquire a repeat recording that is clearer.
- Tachycardia-bradycardia syndrome (tachy-brady) – the rhythm on an ECG is not always continuous across the tracing. The rate and rhythm can vary across the ECG which is why it is important to look at the whole recording. In some cases of atrial fibrillation, the rhythm can vary between very fast (tightly spaced spikes) and very slow (periods with no spikes)- as we discussed last week.
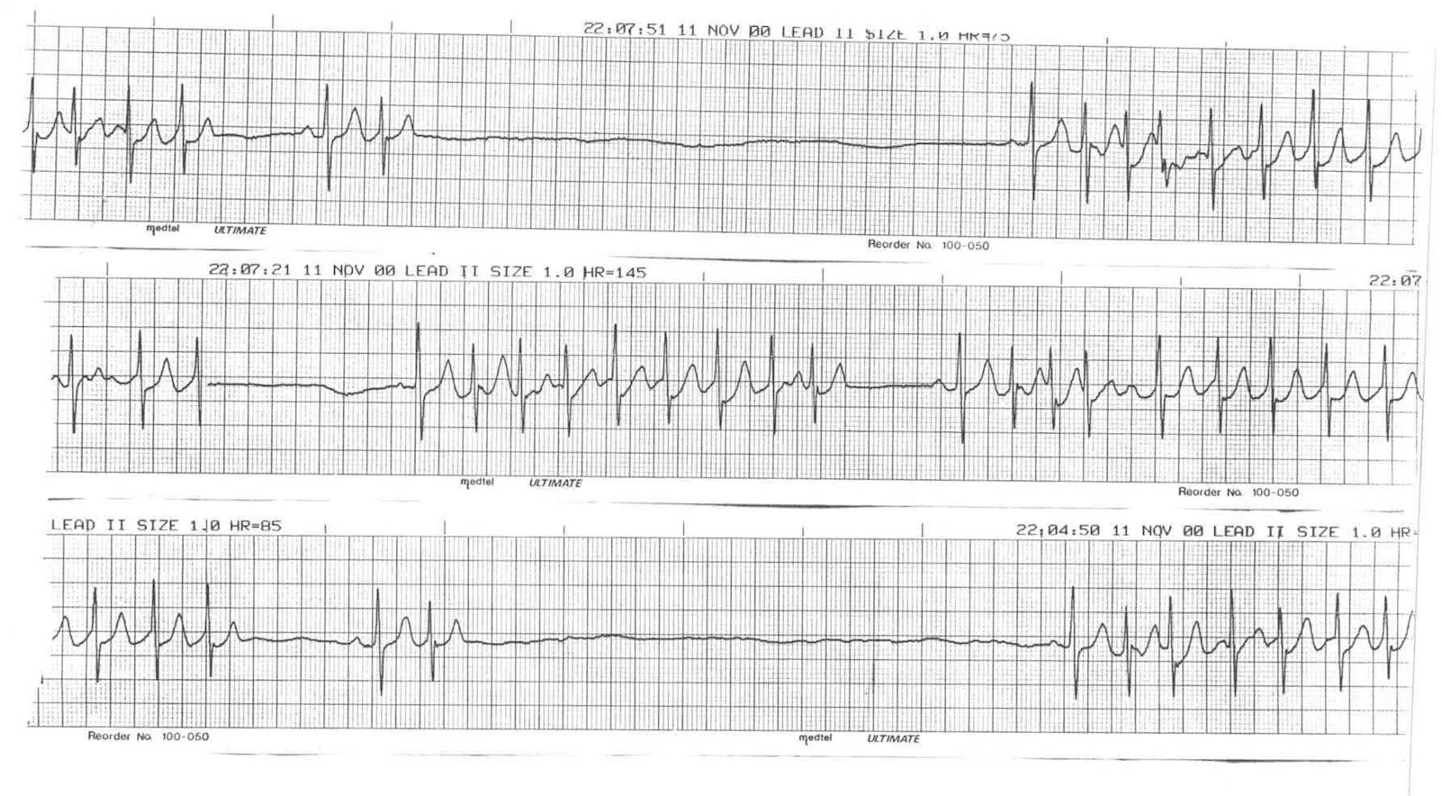
In such cases, a single ECG may not provide the full picture. Longer recordings, such as 24-hour Holter monitors or wearable ECG patches, help capture intermittent abnormalities and correlate them with symptoms.
Symptom Correlation Is Always Key
Alongisde ECG interpretation, understanding whether symptoms like palpitations, dizziness, or breathlessness coincide with the ECG changes is critical. Symptom–rhythm correlation allows clinicians to tailor treatment. This is why recording ECGs during symptoms can be so helpful.